Our Technology
Bringing the Clarity you need to Be Successful in Today’s Complex Data Center Environments

DynamicReporting

ComprehensivePerformance


The Arxview Data Center Analytics Engine (DCAE) brings all of the information needed to analyze and report on the data center together in one light-weight, inexpensive and easy to use solution that always lets you know where you stand. Meaningful, feature rich reporting drives the power to provide up-to-date information in both high-level management views and detailed administrator grids on virtually every storage metric. Migrations, equipment refreshes, utilization and performance reviews, reporting to senior management, back-up sizing, day to day troubleshooting …whatever needs to get done will be quicker, easier, more complete and much more cost effective with Arxscan.
Start making progress today by scheduling a full demonstration of the Arxscan solution.
From high-level specialized projects to day-to-day administration, Arxscan gives any size organization the insight they need for enterprise-level storage and data management initiatives. Unlike Storage Resource Management (SRM) solutions which are targeted solely at storage administrators, Arxscan bridges the gap between the data center and the business users, providing value to all users at both ends of the spectrum.
| Feature | Description |
|---|---|
| Low Cost | More affordable than any competing product. No set up (or other hidden) fees or additional modules to buy. A simple pricing model scales to make the solution affordable for any size environment. |
| Quick Deployment | Arxview is up and running in as little as an hour, with no disruption to the storage network and without the installation of any agents or in-band devices. The Arxscan Deployment Team works with you every step of the way at no charge to ensure that the solution is delivering immediate value. |
| Unified Views of the Entire Enterprise | Arxview reports on the entire storage network regardless of equipment type, vendor, or volume of data. SAN, NAS, DAS and switching are all included in a single intuitive console. |
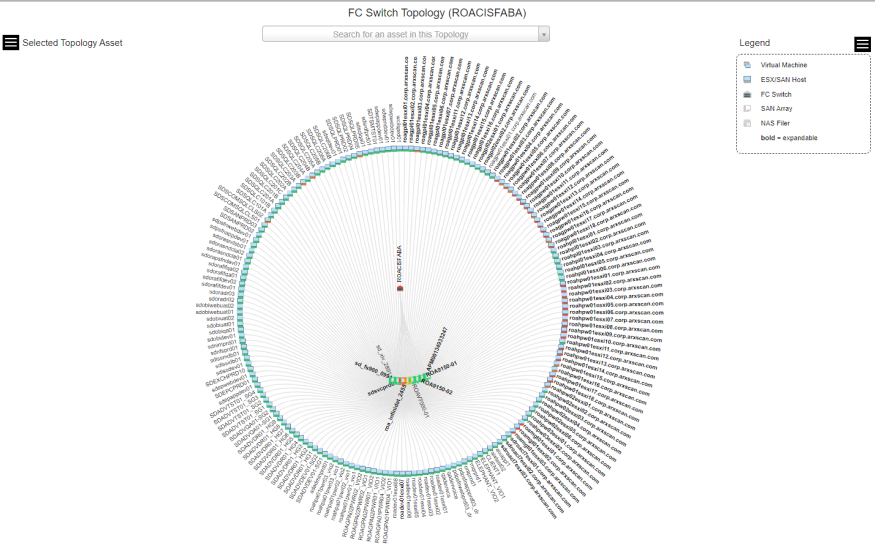
| Data in Context | Arxview shows capacity utilization and trending, power use, line-of-business dependencies and network topologies for end-to-end clarity. |
| Detailed Insight Into Tiered Storage | Dozens of metrics covering all aspects of the storage enterprise, from business usage to device statistics. |
| VMware® Mapping | Arxview maps VMware® relationships from guest servers all the way back to the storage arrays, displaying every item in that path: virtual instances, host servers, virtual datacenters, storage arrays, storage groups, HBAs, and datastores. |
| Full Performance Monitoring | Arxview shows live and historical performance data for a wide range of storage hardware, including Brocade, Cisco, EMC, FalconStor, Hewlett-Packard, IBM, NetApp, and Oracle. |
| Zero-Touch, Agentless Deployment | The light network footprint of our products can be attributed to our agentless design…there are no requirements for the deployment of agents or installation of any application code on any customer storage devices. |
| Chargeback Reporting | Arxview calculates chargebacks based on what is allocated vs. what is actually being used and displays important details about each tier of storage, specific to each business unit. For the first time informed decisions can be made about data age, type and usage trends, by tier, that ties the actual usage to the cost that it generates. |
| Full Line of Business Data Mapping | Arxview maps data back to the organizational structure of your business and identifies key inefficiencies in that context. This allows business users to manage and measure their data use in a way that makes sense to them: by user, division, department, location, network share, file name, file type, storage tier and hosting appliance, empowering them to collaborate with their IT peers in ensuring the quality and allocation levels of their stored data. |
| File-Level Detail | Multiple file level groupings and sorts are available on key data points such as file type, age, size, last accessed and last updated. This allows detailed views of unstructured data while retaining the Line of Business mappings. |
| Power Consumption Reporting | Arxview delivers even greater value to its customers by collecting and reporting on storage appliance power consumption. This breakthrough product feature, unique to Arxview, provides detailed insight into enterprise data storage power utilization. This information is an invaluable part of any action plan that includes the need to allocate and understand power usage and project future power needs. |
| Thin-Client Convenience | Arxview is a platform-independent application that leverages the flexibility of a browser based front end. Any user with logon rights can access the system via a web browser. |
| Fully Compatible with All Leading Storage Vendors | Arxview is compatible with all leading storage types (NAS, SAN, DAS, and switching) and vendors, including Brocade, Cisco, Dell, EMC, FalconStor, Hewlett-Packard, Hitachi, IBM, LSI, NetApp, and Oracle. |
| Extensible Design | Arxview has been thoughtfully designed to drive and present a unique perspective. Understanding that customers will readily benefit from a flexible, responsive model, the core architecture is fully extensible. This architecture allows Arxview to include enterprise defined metrics and calculations to suit the needs or requirements of the enterprise. Custom defined services can also be appended to Arxview as required, providing the leverage to create unique data extracts for use in cube and OLAP tools, or as enhancements to an already comprehensive dashboard. |
| Effortless Data Delivery | Reports are available via a web-based front end and can also be exported for use in MS Excel® or other data manipulation applications, or for import into customer databases. |
| Ease Of Use | Powerful reporting and monitoring functions are controlled by a simple, intuitive interface. Data is easily exported for use in spreadsheets or third-party data analysis applications. |


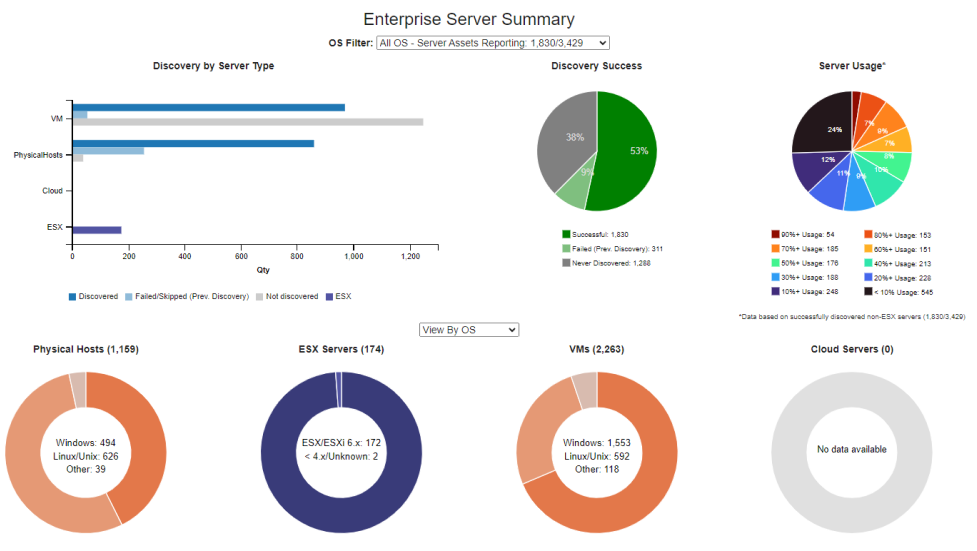
Arxscan’s intuitive presentation layers show the entire storage environment in hierarchical relationships that let the user drill from the top of the enterprise all the way down to the disk and file level with the added benefit of color coded alerting that brings potential issues to the forefront.

Whether it’s total array capacity, LUN level detail, file counts and aging, database inventories across all storage or one of the hundreds of other metrics that Arxscan delivers, the data you need to analyze the environment are at your fingertips and in context with the specific equipment or users impacted.

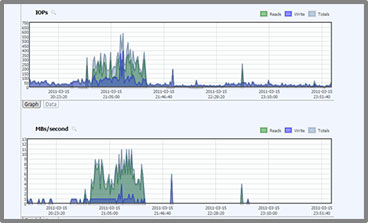
Arxscan reports minute-by-minute performance metrics in trended time lines selected by the user for both storage arrays and switching. Graphic views are supplemented with data tables highlighting spikes and anomalies.